

Where are you losing TPT buyers? SEOTpreneur News 20
VISUALLY SEE where you are losing TPT buyers: Is it thumbnails and product description or your product preview?
How can you tell for FREE?
Well, I just updated the Advanced TPT Data Seller Tool. (Link at the bottom of this email)
- STEP 1. Click on the TPT Product Stats CSV (tab) at the bottom of the Google Sheet.
- STEP 2. Upload your latest version of your Product Stats CSV into the yellow cell (and delete the header row)
- STEP 3. Click on the “10x Dashboard” (tab) at the bottom of the Google Sheet.
Done!
Here’s what my data looks like:
(If the image below doesn’t load, you might have to allow images in this email message)
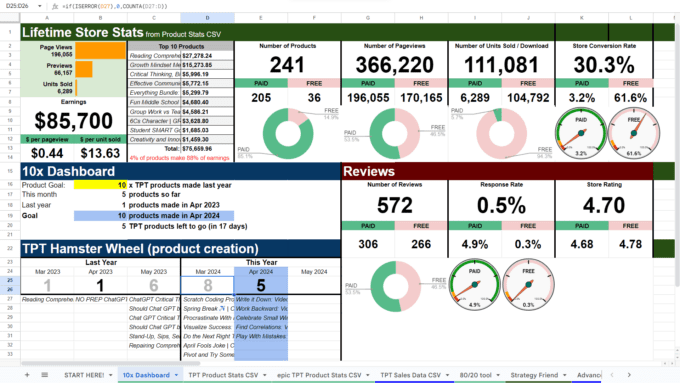 |
The product funnel for my entire TPT store is in the top left corner with the 3 horizontal orange bars.
- The top orange bar is my page views (for the paid resources of my entire store)
- The second orange bar shows my product previews (for my paid resources)
- The third orange bar shows the units sold (for my entire store)
Right away, I can see that my units sold (bottom bar #3) is very small compared to my previews (bottom bar #2).
So, this means I need to improve my previews.
People look at the preview, but then few people decide to buy. So the previous aren’t communicating enough value.
I can see what the top sellers are doing for inspiration about what best practices I need to adopt. (Look at who shows up on the first page when you click on any single grade or category on TPT search.)
For me specifically, I need to experiment with a simple features preview instead of a full watermark preview and see what happens.
Then I can use the ABCD tool to see if that actually made a difference.
- Click here to download a sneak peek version of the ABCD tool if you’ve already purchased the Ultimate Bundle. (Open the zip folder and find the bonus file PDF.)
- The ABCD tool will become free for everyone once the YouTube channel hits 4,000 watch hours in the last 365 days. Our watch hours are down, but that’s another story…
How to visually see the sales funnel for your individual products (for free!)
- STEP 4. Click on the “10x Dashboard” (tab) at the bottom of the Google Sheet.
In the yellow cell (B18), type the number of the TPT product you’d like more information about.
(For example my Reading Comprehension Mega Bundle is #45 in the Product Stats CSV that I download from TPT)
It will then show you the sales funnel with three orange bars.
Check out the image below. You can also see the Preview Rate and the True Conversion Rate for the product.
I haven’t had a chance to create a YouTube video tutorial yet. (Not enough time, so much to do!)
I just wanted you and the SEOTpreneur Email Newsletter community to start playing with this dashboard because it’s crazy what we can now learn about our TPT business… for FREE.
A lot of you here are part of multiple SEOTpreneur communities: the YouTube community, this email community, and the PRO community.
- If you’re part of SEOTpreneur PRO, I posted a quick loom video tutorial here: https://pro.seotpreneur.com/sneak-peek-visual-update-to-the-tpt-seller-data-tool/
- (I’ve got a cold, so it’s not the greatest video lol)
Thanks for reading this email.
I can’t wait to hear about what you discover about your TPT stores! Where are you losing people in your TPT sales funnel?
Cheers,
Mike Fuchigami
Host of the SEOTpreneur email community
Want to know how to make money teachers pay teachers
PS: Is the Review Response Rate for your store 10% (like people often say it is in TPT land?) My store response rate is 0.5 and my paid response rate is 4.9%. What’s yours? Let me know by replying to this email!
PPS: Thank you to the 44 TPT Sellers who have already purchased the ULTIMATE BUNDLE. I’m glad you got a great deal and I can’t wait to add more ridiculous value to the growing bundle! Spread the word so your TPT friends don’t miss out. Right now, the growing bundle is only $5.99 – when I publish the TPT Keyword Research Tool, the price of the growing bundle will go up to $9.99. GET MY TPT SELLER ULTIMATE BUNDLE.