TPT Seller Christmas Gift – Strategy Friend – Episode 32
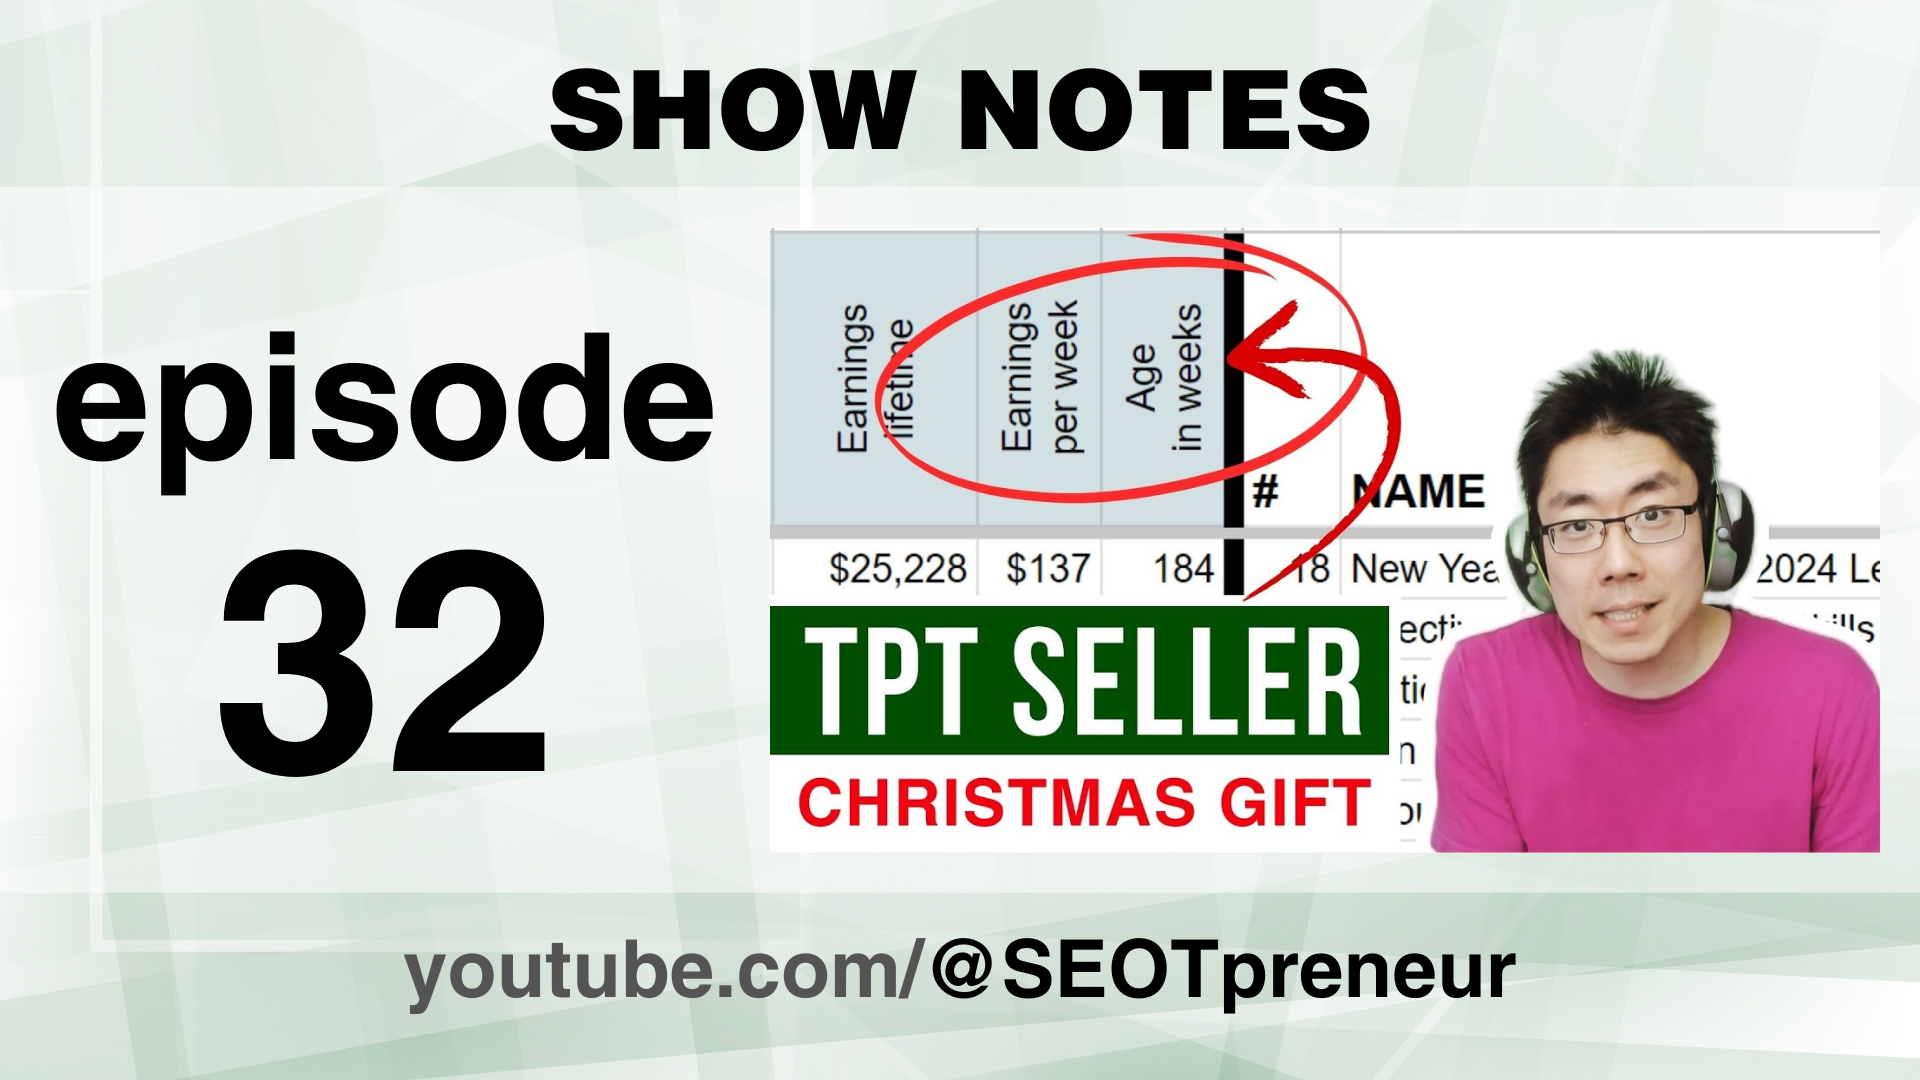
A Christmas Gift for all TPT Sellers. FREE Google Sheet TPT data tool update. The “Strategy Friend” now lets you compare your TPT product lines based on keywords and Earnings Per Week.
In three minutes, you can be looking at your TPT Seller Data (Product Stats CSV) in a way that’s never been possible before for free. Check out this free TPT seller tool.
Watch the Video
Click here to watch on YouTube.
Questions? Comments? Need Help?
- Any questions? Do you agree or disagree? Challenge my assumptions!
- Need help? Maybe I can provide suggestions!
Say something in the YouTube video comments
VIDEO TABLE of CONTENTS
- 0:00 Sneak Peek
Transcript
(00:00):
Hi TPT Sellers, I have an awesome gift for you. You’re going to hands down, love it. You’re going to be able to do things with your TPT products that CSV that you’ve never been able to do before for free. You’re going to be able to make informed decisions about which product lines are doing well and which product lines maybe not so much. You can look at the data and play with it and visualize it to help you figure out strategies where to go in the new year. I’m going to show you a little bit of how the strategy friend works and then I’m going to show you how to upload the data and I’ll walk you through some of the more finer points of this tool. So strategy friend, that’s what I call it right here on the left hand side I have list A, and that’s basically my product stats.
(00:43):
CSVI want to figure out is my chat GPT Critical Thinking line, how is that product line doing? Let’s figure it out. So if I type the word chat instantly, what it does is it pulls out any product that has the word chat in the title and it puts it into list B. In fact, let’s say I want to think about how my digital literacy or media literacy stuff is doing. So I’m going to type media, so now it’s pulled out all the product titles with media and maybe I’ll type digital and it’s going to pull out anything else. So if it has any of the words in this left column, for example, chat or media or digital, it’s going to pull it out into list B and then I can start to make some comparisons. So right away you can see how you can use this to compare how my Christmas resources are doing.
(01:25):
Let’s see how my Thanksgiving resources are doing. Let’s see if I can see any patterns with different seasons or my evergreen products or my articles or my product lines. So this is a very cool way that we can compare the products that’s CSV, but wait, that’s not it. There’s more. Check this out. I want to go back to my chat. GPT. So I’m just going to look at my chat GPT resources. When I look at list B, I know that this product number 19, that’s my critical thinking bundle that’s been around for a long time and basically when I came out with my chat GPT resources, I included them into the critical thinking bundle because one, my goal is to provide so much value, it’s just unfair, right? I want to be so good, you can’t ignore me, so I’m trying to continue to provide value.
(02:09):
Adding resources to the bundles and the chat GPT product then becomes a pathway to upgrade into larger bundles. This critical thinking resource item number 19 in my CSV is not really fair to include it in my analysis for chat GPT. So all I’m going to do is right here in the second column, I’m going to ignore this product number and I’m going to type 19 and I’m going to ignore it. And so now it’s gone. Now I can see list B in the orange. This accounts for 0.6% of my total earnings and that one resource that I took out, 19, that’s this gray section on the right hand side and the green section is the rest and list a well, I want to do a little bit deeper of an analysis because if I look at this, I’m thinking 0.6% of my earnings, that’s not very good.
(02:54):
Maybe this isn’t a good product line. Maybe I should go in a different direction. Okay, this is super cool up here. Above these little black borders, I’ve hidden it only because it can be a little intimidating if you have a lot of data all at once. So if I click on this plus sign above this black line, if I click on it, if I open it up and I’ll open up the other side as well. Now we can see per week and the age of the product in weeks. Now we can actually compare products that we released years ago. They’ve been around longer, so of course they’ve made more money. Well, let’s compare how much money is that resource making per week and then we can compare newer resources against older resources. Now above the letter T, there’s another box over here. If I expand it, this is the regular product stat CSV that we’re used to seeing.
(03:41):
It tells us the post-it date when the resource was posted. So all this Google sheet does, there’s a formula and it basically just figures out today’s date and figures out how many days ago the product was released, divides it by seven, that’s the aging weeks. And then if you take your earnings and divide that by the number of weeks we have earnings per week. When I look at this, I see, well, my reading comprehension resource is like $137 per week, but that’s not really a fair product because I’ve been running a lot of ads. So all of those numbers are going to be inflated. And so 44,000 page views, that’s not typical because I’m running ads, so I’m going to take product number 45, I’m going to exclude it, I’m going to ignore it from the analysis. So again, this gray section here, that’s part of my total earnings that we’re not even thinking about and list A and list B, I want to figure out list B, how that’s doing.
(04:32):
I see here my chat GPT resource, it makes on average $10 per week. That seems pretty good compared to the other ones here. If I look on list A, they’re mostly ones and zeros. So maybe my chat GPT resource is doing pretty well. I’m not really sure. I’m going to go look at the actual products that CSV. So here’s my products that CSV and I’ve uploaded into the Google sheet here and over here I can see the age in weeks, earnings per week, and if I, oh, I’m already in paid resources, I can click on here, show paid resources, and it’ll just show me the paid resources and I can filter it by earnings per week or sort it Z to a. I can see right here. Here’s my chat. GPT resource. Well, relatively speaking out of, I dunno, 150 resources or whatever it is.
(05:16):
This is in the top 10. So this chat GPT product line where initially I might’ve thought, you know what? It’s only such a small portion of my earnings, actually earnings per week. If I use that as a metric to compare my resources, it’s doing pretty well. And so maybe my strategy of continuing to produce resources and then I link it to, because I use chat GPT to create my resources, right? I use it as a partner in coming up with ideas and brainstorming. So then somewhere in my resource I say, Hey, this resource was co-created with chat. GPT should chat GPT be used in the classroom. Here’s a free resource. Here’s a free classroom debate that you can use. And so that goes to a freebie. The freebie, then upsells to the handouts, which are a paid resource. And then those handouts then upsell to the chat GPT bundle, which then upsells to the critical thinking bundle, which then upsells to the growth mindset learning bundle, which then upsells to everything bundle.
(06:11):
So maybe this tragedy is working for me, I kind of like this. What else can I do? I know I want to get a sense of page views and the challenge with page views is if I scroll down to the bottom, I’m going to start to get into these free resources because there’s a download rate and I know that my best downloaded free resource has been downloaded 69,000 times, so that’s probably skewing this number. I can get rid of those free resources in the analysis just by clicking this box over here. I just unclicked free and now this is only showing me my paid resources. If I want to show just the free resources, I have to go up to the top here and I can see an analysis of my free resources. But really I want to look at just the paid resources. So here’s an easy way for me to look at my paid resources.
(06:56):
Crazy. If you like what you see so far, can you give this video a thumbs up that helps the YouTube algorithm share this with other TPT sellers like you so they can also use this free seller tool. I’m going to show you how to get it and then we’re going to walk you through the data, set up my data and get the strategy friend in less than two minutes. Ready? Okay, here we go. I’m going to press start. So the very first thing I need to do is I need to go to a free seller tool.com and I also need to go to my teacher’s pay teacher store. I need to make sure I’ve logged in, which I have, and then I’m just going to go to my store because I’m going to need the website URL in a second. So a frees seller tool.com.
(07:36):
I’m going to click on download. I’m going to sign up for the SET Premier newsletter, [email protected]. I need to paste in the link to my store. So here it is. I hit subscribe. It’s going to send me an email off camera. I’m going to go to my email. I found an old copy of my email invite in here. There’s going to be a blue button to confirm your subscription. I click on that. It’s going to give me a one click copy link to make a copy of this resource. So I’m getting my own copy of this Google sheet. It’s not connected with anyone else. It’s my private data. I am going to write something in the title. You should probably write something in the title too, because we get a lot of copies of this, right? So Mike, YouTube copies. So if you use this a lot, then eventually have a million of these files.
(08:18):
So I need to step one, download the TPT product stats, CSV, which I can do by clicking on this link, and I could wait for TPTI find the first time it takes a little bit of time here. I could click on download to Excel just like normal, and it’s going to download the file somewhere on my computer. There we go. So I’m going to save this to my computer. I’m going to call it 2023 B just for a clean spot here, but there’s a faster way. There is a button here that says Download shortcut. If I click on it and then I click on the link that pops up, it’s going to automatically download the file. So I’ve saved it to my computer, I go to my Google sheet, I click in this yellow cell, I click file import, upload browse. I go to wherever it’s saved.
(09:00):
So I’m going to save it here. I’m going to click on replace data at selected cell import data. There’s my data. I’m going to click on row three. I’m going to right click it. I’m going to click delete row, and now all of my data is here and up here. If I click on Strategy Friend, boom, there it is. That was two minutes, 41 seconds. Nice. So in less than three minutes you can be up and running and playing with your data. Now, I’m going to go back a step because I’ve updated some things here. My philosophy is to just start, which I’ve internalized to mean start at 80% perfect. It doesn’t have to be perfect. I launched this product when it was 80% perfect. It was good enough. There was some interesting strong emotions about it. I pivoted, I changed some things. As I get feedback, I’m constantly updating and improving the product.
(09:49):
Now, the challenge is if I had waited to get to 95% perfect, I wouldn’t have known what I needed to change at that point, and maybe I would’ve spent a lot of time calling it one thing and then having to backtrack and calling it something else. So again, we learn from mistakes. We sort of grow here. We have this tool up here on the top left-hand side. I’m now putting the version date. So in the YouTube videos, you can very quickly see which version I’m talking about because every YouTube video, there’s some sort of enhancement or added feature. This is completely free. I have some links up here like a menu, and if I click on show all resources, that’s going to show this filter. If I click on show paid, it’s going to sort it over here and it’s going to sort it based on the earnings.
(10:31):
So these are all my paid resources. If I want to sort it by the earnings per week, I just click on that triangle sort Z to A, and now it’s sorting by earnings per week. And I can tell that because over here I have some numbers that aren’t in order. If I want to go back to show all resources, I can just click on that and I don’t see anything here. But if I scroll up to the very top, it’s just because I’m at the bottom of the sheet. So here I am over here, I want to see my free resources. I can click on that. So these are my free resources sorted by page views. Now, these links here, they remember whatever you last sorted on. So it’s not always going to stay on the settings that when you first download it. So if I sort this by page views, for example, sort Z to A, so these are now sorting by page views.
(11:13):
If I go back to free, if I come back to the page view, it still remembers that setting up here I have the 80 20 tool, which is right here. If you’re new to this channel, hey, welcome. But if you go to a free seller tool.com, if you click on videos, it explains all of the different videos that I’ve done and different sections you can jump to watch how to use that part of the tool. So this is my 80 20 tool, but I’m just going to go back to the products that CSV. So these links with Google Sheet, you actually have to click twice. The first time is to click in the sell. The second time is to actually click on the link. So now I’m back here on my paid resources. I want to actually go to my strategy friend here. So let’s click on Strategy Friend.
(11:52):
This is the big page here. A couple of things to know. So page views, preview rate, download rate, conversion rate, earnings, lifetime, which we’re used to. If I click on the little plus sign above these black lines, I can open up these hidden columns that show us earnings per week and age per week above. Here are some numbers. I’m trying to be able to compare two different lists. So I am adding up the page view so you get a sense of the total number of page views for that product line or your store. Likewise, same thing with the earnings for the lifetime amount. So you get a sense of scale, but everything else is an average because I want to compare sort of the middle of those two lists. Up here at the top, this green line is all the way across. That’s total earnings.
(12:38):
So this number here, 80,000, $56. If I scroll up to the very top here on list A, you can see the sum of list A right now is $80,000. So that’s how much I’ve made in my store lifetime, and that number here shows up on both sides. When I type something like reading, if I want to pull out all my reading resources, I can see here that the total lifetime earnings of my store hasn’t changed. It’s always $80,000 here. The numbers are comparing list A versus the total lifetime earning of my store and list B. In this case, these products add up to be $28,000. It’s comparing that 28,000 of $80,000. So that’s what the green and the orange mean. Over here I showed you last time, I can hide specific numbers as many numbers as I want. So here’s 45, and let’s say I want to get rid of 18.
(13:26):
I can just type these numbers and it’ll automatically hide it, and as it hides it, it’s completely removed from list A and list B. So that’s why we have some gray space showing up there. Find as many products as you want. If the word shows up here, so if I put six C’s, any product that has six C’s or reading will show up here on the right hand side. If I want to double check the numbers, I can just open up the fields, this little plus sign above the page views, and that’ll show the actual TPT product, stat CSV that we’re used to seeing. I have a question for you. Would you help another TPT seller if you never met them and they never found out that you helped them? If the answer is yes, I’ve got the perfect solution for you, and it’s free.
(14:08):
If you watch this video, if you use this tool, if you find it useful and you figure out something that you didn’t realize about your store before, can you leave a comment and let me know what it was? That feedback helps me update and upgrade and come up with more features with this TPT product stats tool. This is for us to level the playing field so that we all can look at our data and make data informed decisions. Let’s try to optimize what we do. I’ve chatted with a lot of people this month who have joined the SO TPR Pro community. It’s a fantastic opportunity for me to learn a little bit about their store. I’ve learned that there’s a good chunk of people who watch the channel, but they’re not comfortable leaving a comment on YouTube. Hey, I love having you here. You can still help out.
(14:55):
You can help other TPT sellers at a different stage of the game. Find this video by watching more videos, TPT, YouTube, Google Search. They’re all based on algorithms. The algorithm tries to figure out, well figure out what’s popular. So the way to help out would be to go to the mega list and just click Play all. Yeah, there’s lots of exciting stuff in there, but you’re sending a signal to YouTube. Hey, people who watch this video also like that video, and that helps this video get in front of other TPT sellers who maybe haven’t heard about this yet. My name is Mike Ami. Welcome to the SEO TPR YouTube channel and have a Merry Christmas if you celebrate Christmas. Happy holidays. Happy New Year, and good luck reaching those targets in 2024.


