Your TPT Sales Slump Might Be Because Of This…
I’ve been digging into the raw TPT order counts for the last four years, and the trend is hard to miss:
- 2022 slipped 2.2 % from 2021.
- 2023 slid another 5.1 %.
- 2024 dipped only 1.3 %.
In plain English, we’ve seen about an eight‑percent drop in total orders since 2021.
(Here’s how you can figure out how many orders were placed on TPT.)
Your TPT Sales Slump Might Be Because Of This
When the whole pie shrinks, your slice can shrink even if you’re doing everything right.
Scroll down to the image at the end of this email.
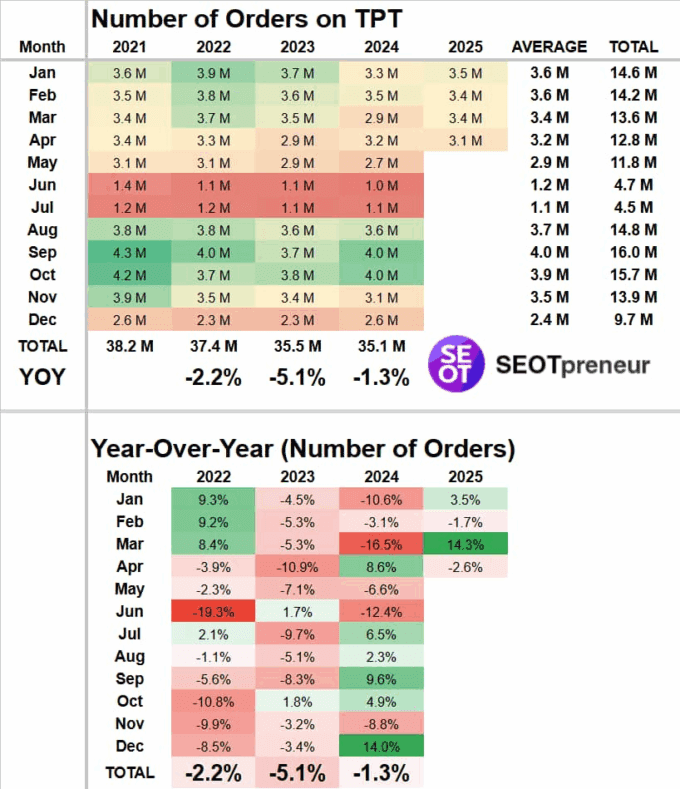
The first table tells you roughly how many orders hit TPT each month.
The second table shows how those numbers rose or fell compared to the year before.
- Example 1: January 2024 orders on TPT dropped ‑10.6 % from the year before.
If your own January 2024 sales were down about the same, the market—more than your store—may be to blame.
- Example 2: January 2025 orders have bounced back +3.5%.
If your January sales are exactly the same as last year, your store performance is actually down compared to the platform.
- Example 3: March 2025 orders increased 14.3% platform‑wide.
If you grew that month, is it because of actions you took? Or because teachers are buying more on TPT?
In short, some of the swings we see in our TPT dashboards can come from TPT as a whole, not just our thumbnails or keywords.
Is it the algorithm? The economy? Or both?
Some questions to think about:
- Are people buying $1 resources more than larger bundles? (We don’t know the average order size. We only know the approximate number of orders placed on TPT.)
- Do rising prices push shoppers to wait for site‑wide sales?
- Has government spending changed in a way that will impact sales on TPT?
What reasons do you see behind the ups and downs? Hit reply and let me know—there’s always something I haven’t thought of.
Cheers, Mike