The TPT Seller Yearbook Community Survey is NOT official TPT data. It’s an annual survey run by Mike Fuchigami (SEOTpreneur) to help provide benchmarks to guide TPT Sellers
2025 TPT Seller Yearbook Survey Results
How do I find my Store Ranking and Store Percentile in the 2025 TPT Seller Yearbook?
How do you compare with other sellers in your percentile?
If your store percentile stayed the same between 2024 and 2025, use the table below to see how your peers did
|
Store percentile |
2024 earnings |
2025 earnings |
Year Over Year change |
|---|---|---|---|
|
Rank 1 – 100 |
$48.57 M |
$43.17 M |
-11.1% |
|
Rank 101-1000 |
$92.35 M |
$86.79 M |
-6.0% |
|
99% |
$179.30 M |
$167.23 M |
-6.7% |
|
98% |
$24.43 M |
$24.30 M |
-0.6% |
|
97% |
$11.87 M |
$11.91 M |
0.3% |
|
96% |
$7.25 M |
$7.30 M |
0.6% |
|
95% |
$5.14 M |
$4.96 M |
-3.6% |
|
94% |
$3.62 M |
$3.69 M |
1.9% |
|
93% |
$2.67 M |
$2.80 M |
4.9% |
|
92% |
$2.17 M |
$2.23 M |
2.9% |
|
91% |
$1.79 M |
$1.68 M |
-6.4% |
|
90% |
$1.43 M |
$1.34 M |
-6.1% |
|
89% |
$1.20 M |
$1.21 M |
0.8% |
|
88% |
$1.01 M |
$1.07 M |
5.7% |
|
87% |
$0.86 M |
$0.92 M |
7.8% |
|
86% |
$0.77 M |
$0.80 M |
3.7% |
|
85% |
$0.67 M |
$0.69 M |
2.7% |
|
84% |
$0.61 M |
$0.61 M |
-0.3% |
|
83% |
$0.58 M |
$0.55 M |
-6.0% |
|
82% |
$0.56 M |
$0.49 M |
-12.8% |
|
81% |
$0.53 M |
$0.42 M |
-20.2% |
|
80% |
$0.50 M |
$0.37 M |
-27.2% |
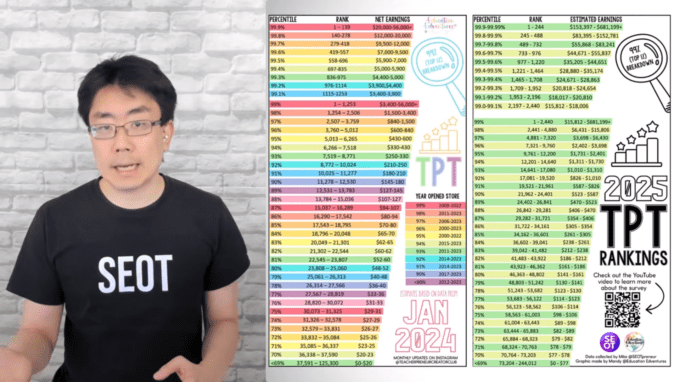
How much money did TPT Sellers make (by percentile)
|
PERCENTILE |
MIN of Rank |
MAX of Rank |
MIN of Earnings |
MAX of Earnings |
RANK |
ESTIMATED EARNINGS |
|---|---|---|---|---|---|---|
|
99.90 – 99.99 |
1 |
244 |
$153,397 |
$681,199 |
1 – 244 |
$153,397 – $681,199+ |
|
99.80 – 99.90 |
245 |
488 |
$83,395 |
$152,781 |
245 – 488 |
$83,395 – $152,781 |
|
99.70 – 99.80 |
489 |
732 |
$55,868 |
$83,241 |
489 – 732 |
$55,868 – $83,241 |
|
99.60 – 99.70 |
733 |
976 |
$44,671 |
$55,837 |
733 – 976 |
$44,671 – $55,837 |
|
99.50 – 99.60 |
977 |
1,220 |
$35,205 |
$44,651 |
977 – 1,220 |
$35,205 – $44,651 |
|
99.40 – 99.50 |
1,221 |
1,464 |
$28,880 |
$35,174 |
1,221 – 1,464 |
$28,880 – $35,174 |
|
99.30 – 99.40 |
1,465 |
1,708 |
$24,671 |
$28,863 |
1,465 – 1,708 |
$24,671 – $28,863 |
|
99.20 – 99.30 |
1,709 |
1,952 |
$20,818 |
$24,654 |
1,709 – 1,952 |
$20,818 – $24,654 |
|
99.10 – 99.20 |
1,953 |
2,196 |
$18,017 |
$20,810 |
1,953 – 2,196 |
$18,017 – $20,810 |
|
99.00 – 99.10 |
2,197 |
2,440 |
$15,812 |
$18,006 |
2,197 – 2,440 |
$15,812 – $18,006 |
|
model percentile |
MIN of Rank |
MAX of Rank |
MIN of Earnings |
MAX of Earnings |
RANK |
ESTIMATED EARNINGS |
|
99 |
1 |
2,440 |
$15,812 |
$681,199 |
1 – 2,440 |
$15,812 – $681,199+ |
|
98 |
2,441 |
4,880 |
$6,431 |
$15,806 |
2,441 – 4,880 |
$6,431 – $15,806 |
|
97 |
4,881 |
7,320 |
$3,698 |
$6,430 |
4,881 – 7,320 |
$3,698 – $6,430 |
|
96 |
7,321 |
9,760 |
$2,402 |
$3,698 |
7,321 – 9,760 |
$2,402 – $3,698 |
|
95 |
9,761 |
12,200 |
$1,731 |
$2,401 |
9,761 – 12,200 |
$1,731 – $2,401 |
|
94 |
12,201 |
14,640 |
$1,311 |
$1,730 |
12,201 – 14,640 |
$1,311 – $1,730 |
|
93 |
14,641 |
17,080 |
$1,010 |
$1,310 |
14,641 – 17,080 |
$1,010 – $1,310 |
|
92 |
17,081 |
19,520 |
$826 |
$1,010 |
17,081 – 19,520 |
$826 – $1,010 |
|
91 |
19,521 |
21,961 |
$587 |
$826 |
19,521 – 21,961 |
$587 – $826 |
|
90 |
21,962 |
24,401 |
$523 |
$587 |
21,962 – 24,401 |
$523 – $587 |
|
89 |
24,402 |
26,841 |
$470 |
$523 |
24,402 – 26,841 |
$470 – $523 |
|
88 |
26,842 |
29,281 |
$406 |
$470 |
26,842 – 29,281 |
$406 – $470 |
|
87 |
29,282 |
31,721 |
$354 |
$406 |
29,282 – 31,721 |
$354 – $406 |
|
86 |
31,722 |
34,161 |
$305 |
$354 |
31,722 – 34,161 |
$305 – $354 |
|
85 |
34,162 |
36,601 |
$261 |
$305 |
34,162 – 36,601 |
$261 – $305 |
|
84 |
36,602 |
39,041 |
$238 |
$261 |
36,602 – 39,041 |
$238 – $261 |
|
83 |
39,042 |
41,482 |
$212 |
$238 |
39,042 – 41,482 |
$212 – $238 |
|
82 |
41,483 |
43,922 |
$186 |
$212 |
41,483 – 43,922 |
$186 – $212 |
|
81 |
43,923 |
46,362 |
$161 |
$186 |
43,923 – 46,362 |
$161 – $186 |
|
80 |
46,363 |
48,802 |
$141 |
$161 |
46,363 – 48,802 |
$141 – $161 |
|
79 |
48,803 |
51,242 |
$130 |
$141 |
48,803 – 51,242 |
$130 – $141 |
|
78 |
51,243 |
53,682 |
$123 |
$130 |
51,243 – 53,682 |
$123 – $130 |
|
77 |
53,683 |
56,122 |
$114 |
$123 |
53,683 – 56,122 |
$114 – $123 |
|
76 |
56,123 |
58,562 |
$106 |
$114 |
56,123 – 58,562 |
$106 – $114 |
|
75 |
58,563 |
61,003 |
$98 |
$106 |
58,563 – 61,003 |
$98 – $106 |
|
74 |
61,004 |
63,443 |
$89 |
$98 |
61,004 – 63,443 |
$89 – $98 |
|
73 |
63,444 |
65,883 |
$82 |
$89 |
63,444 – 65,883 |
$82 – $89 |
|
72 |
65,884 |
68,323 |
$79 |
$82 |
65,884 – 68,323 |
$79 – $82 |
|
71 |
68,324 |
70,763 |
$78 |
$79 |
68,324 – 70,763 |
$78 – $79 |
|
70 |
70,764 |
73,203 |
$77 |
$78 |
70,764 – 73,203 |
$77 – $78 |
|
<69 |
73,204 |
244,012 |
$0 |
$77 |
73,204 – 244,012 |
$0 – $77 |
How do I calculate my TPT Seller annual store percentile with decimals?
- Look up your TPT store rank for 2025 (Watch the video)
- Divide your 2025 annual store rank by 244,012
- Take 1 and subtract that number
- Multiply by 100
Use your store percentile to find the next rung on the earnings ladder below in the infographic.
Online calculator coming soon
Sign up for the email newsletter to find out when it’s ready
2025 TPT Seller yearbook Survey Infographics
Check out Mandy @education edventures
- Visit Teacherpreneur Creator Club on Instagram
- Click Data (stories)
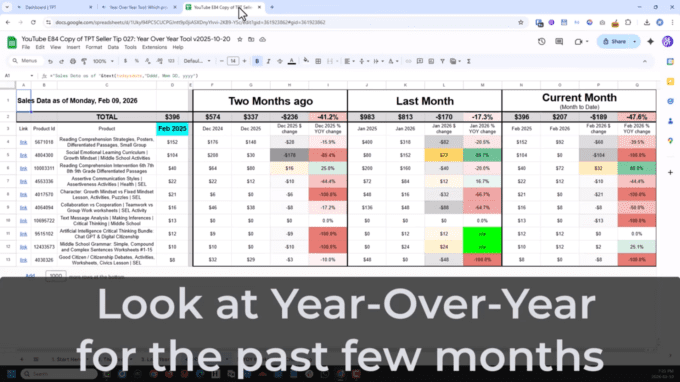
How did you figure out your Year Over Year for the past few months / weeks?
I used the Year Over Year Tool: Which products are underperforming? | TPT Seller Tip 027
- PRO TIP: Don’t buy the individual resource. Instead, buy the TPT Seller Ultimate Bundle which includes everything and is cheaper.
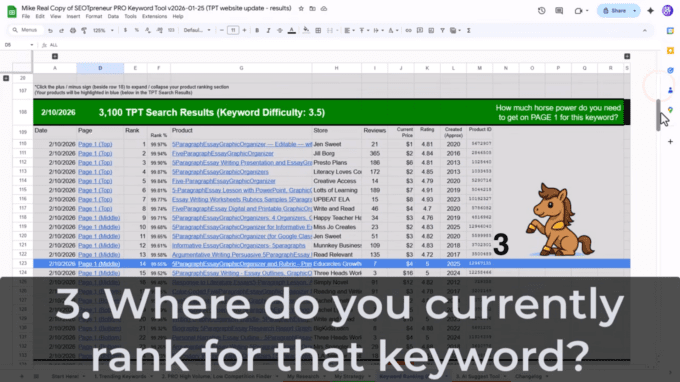
What was the keyword tool that you used in the video?
There are two keyword tools.
There’s the Chrome Extension keyword tool that is currently only available to PRO members (and PRO tool plans)


And then there’s a Google Sheet keyword tool.
The one shown in the video is the PRO keyword tool (available in the PRO membership and PRO tools plan)
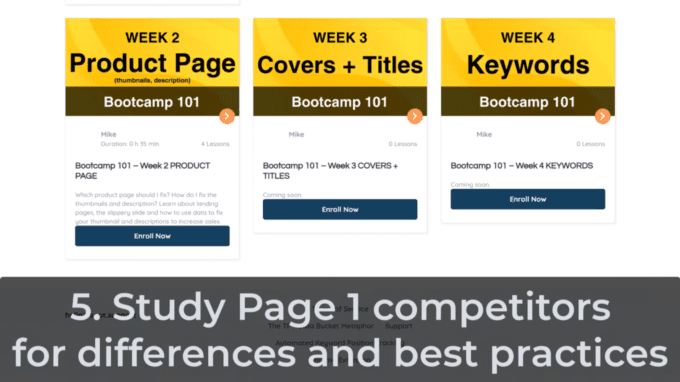
What’s this TPT Seller bootcamp that you were talking about?
Bootcamp is a process to look at your data and systematically fix your products.
It includes lessons (videos), a discussion forum (accountability), and a mini-mastermind (weekly zoom call)